Land Cover (formerly Crop History) can be viewed within the Insights Panel for any selected boundaries, within our customizable Property Report, or on the Property Summary for a single parcel.
To view Land Cover within the Insights panel, follow these steps:
- Start by making a selection on the map.
- On the left navigation bar click Insights > Land Cover.
- A new panel will appear showing a radial chart and legend for the type of land cover (crops, trees, development, grasses, wetlands, etc.) on the selected land.
- The colors as outlined in the legend will be overlaid on the map.
- The layer will be shown (in a lighter color) on the entire map but only the selected parcel or parcels are given a calculated breakdown.
- Note that for calculations, boundary selections must be less than 150 square miles or 96,000 acres in size or distance.
- To view the available land cover history, scroll and click on the desired year — this will show the coverage breakdown for that year and change the overlay on the map.

Land Cover can also be viewed...
- On our customizable Property Reports
- On our Property Summary for individual parcels (as shown below).
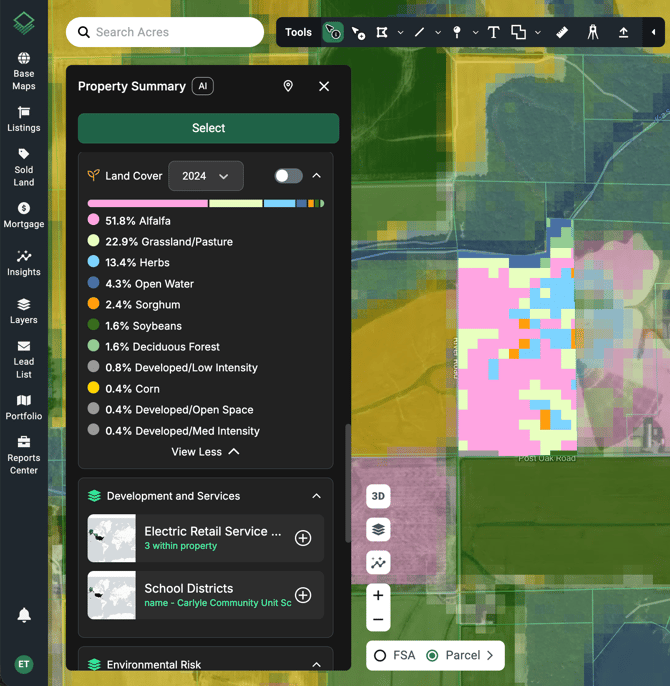
Note: Acres' Land Cover data comes from the USDA NASS Cropland Data Layer (CDL). For the state of California, CDL data is supplemented with data from the California Natural Resources Agency.