
With Acres, you can generate a professionally designed PDF report for selected parcels in seconds. These reports will include a number of insights, customized by you, as well as the option to add a Sales Report, Layers, or Site Plans. Scroll to the end for a YouTube Video Tutorial.
Note: If you need access to unlimited reports, compare plans here and choose a subscription that works for you.
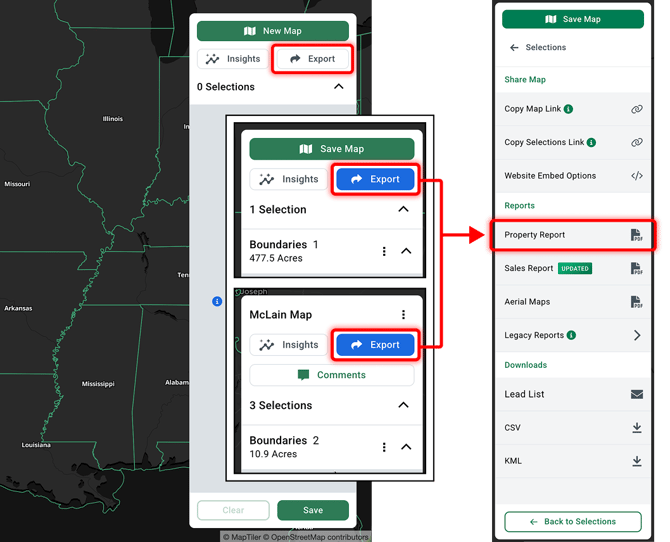
You can generate a property report when at least one boundary has been added to your selections panel (with or without saving the map). Click the Export button on the top right of the right-hand selections panel to access your options.
With nothing in your selections panel, the Export button will be white. With selections made, the Export button will be blue.
Steps
- Click on Export.
- Find the Reports section and click Property Report.
- A modal will pop up so you can preview your report as you customize it.
- The left side is the Settings. The right side is the live preview. The number of pages is listed on the top right (when scrolled to the very top).
- A few tips:
- Look for the green check box to the left of the category name. Keep it selected to include it in the report. Unselect it to exclude it.
- Click on the name of the category to jump to that page.
- Click on the down arrow to open up the category for further customization.
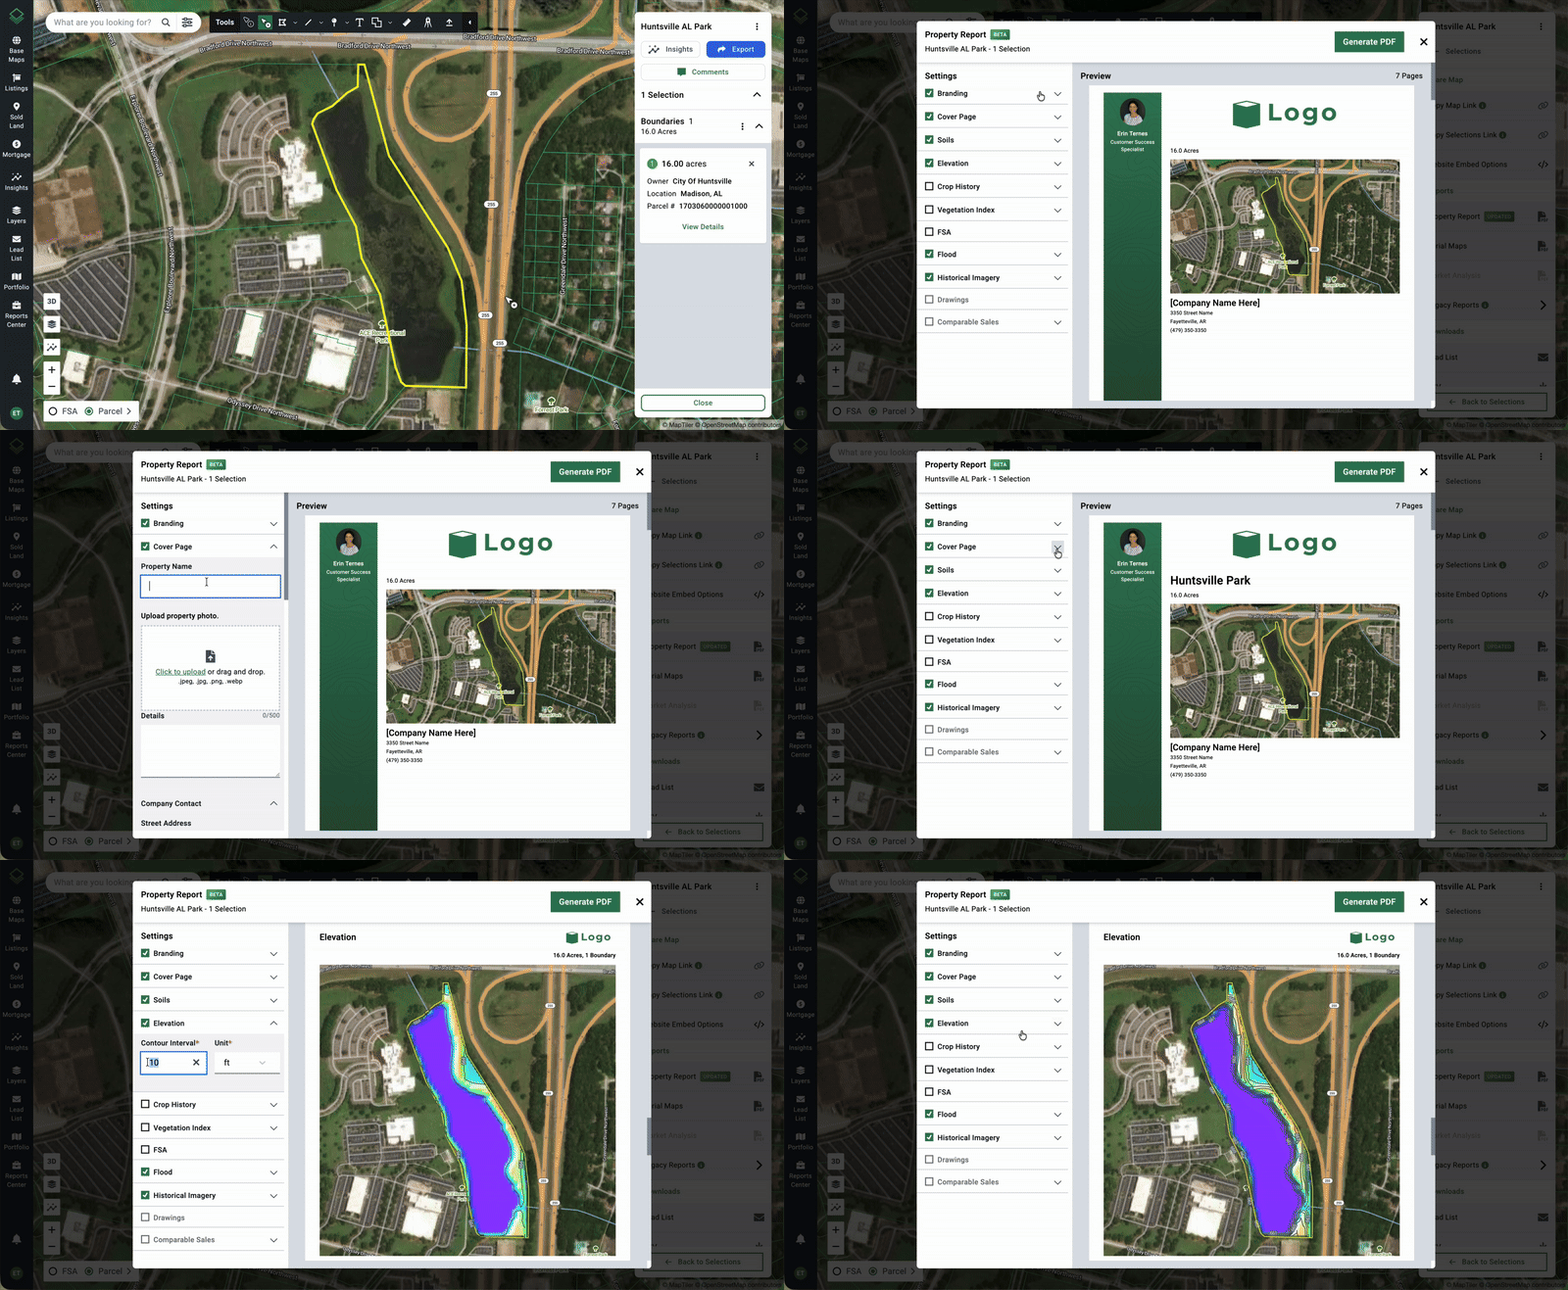
- From here, there are a number of options to customize your report.
* = Enterprise-only.-
Branding
Company name & logo. -
Cover Page
Property name, photo (replace the default arial map), notes, company and contact information, & profile picture. - Page Numbers
Check the box to include page numbers. -
Property Overview
Property Aerial Page and Boundary Details Pages with or without drawings. -
Soils
NCCPI and/or State Score (where available). Soils by boundaries for maps with multiple boundaries selected. -
Elevation
Intervals (between 0.1 and 50 feet) and units (ft or m). -
Land Cover
Year selection between 2025-2024. -
Vegetation Index
Year selection between 2025-2024. -
FSA
-
Flood
With or without map panel data. -
Historical Imagery
1, 2, 4 or 6 years. - Layers
To activate, have at least 1 active layer on the map. If you have multiple layers active on the map, you'll have the choice to include any or all. One layer per page. Legend included and reflected based on appearance settings and filtering. - Drawings
Requires at least 1 drawing to be activated. - Site Plans
To activate, have at least 1 Site Plan on your map. Customizations include Boundaries, Allocations, Lots, Exclusions, & Roads. -
Comparable Sales
To activate, add at least 1 and up to 30 sales to the selections panel. Customizations include adding sales detail pages, calculated value (automatic based on selected sales), estimated value (single amount or range), comments, and soils data.
-
- When the report is ready, click Generate PDF on the top right. This may take a few minutes depending on the size of the report.
- To access the reports you’ve run, go to your Reports Center at the bottom of your left-hand navigation menu. Reports will also either be emailed to you when complete or downloaded to your computer automatically.
Learn more: Access Your Reports