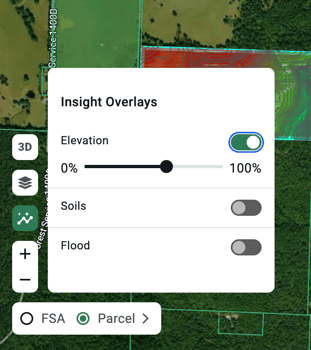
Elevation can be viewed within the Insights Panel for any selected boundaries, within our customizable Property Report, or on the Property Summary for a single parcel.
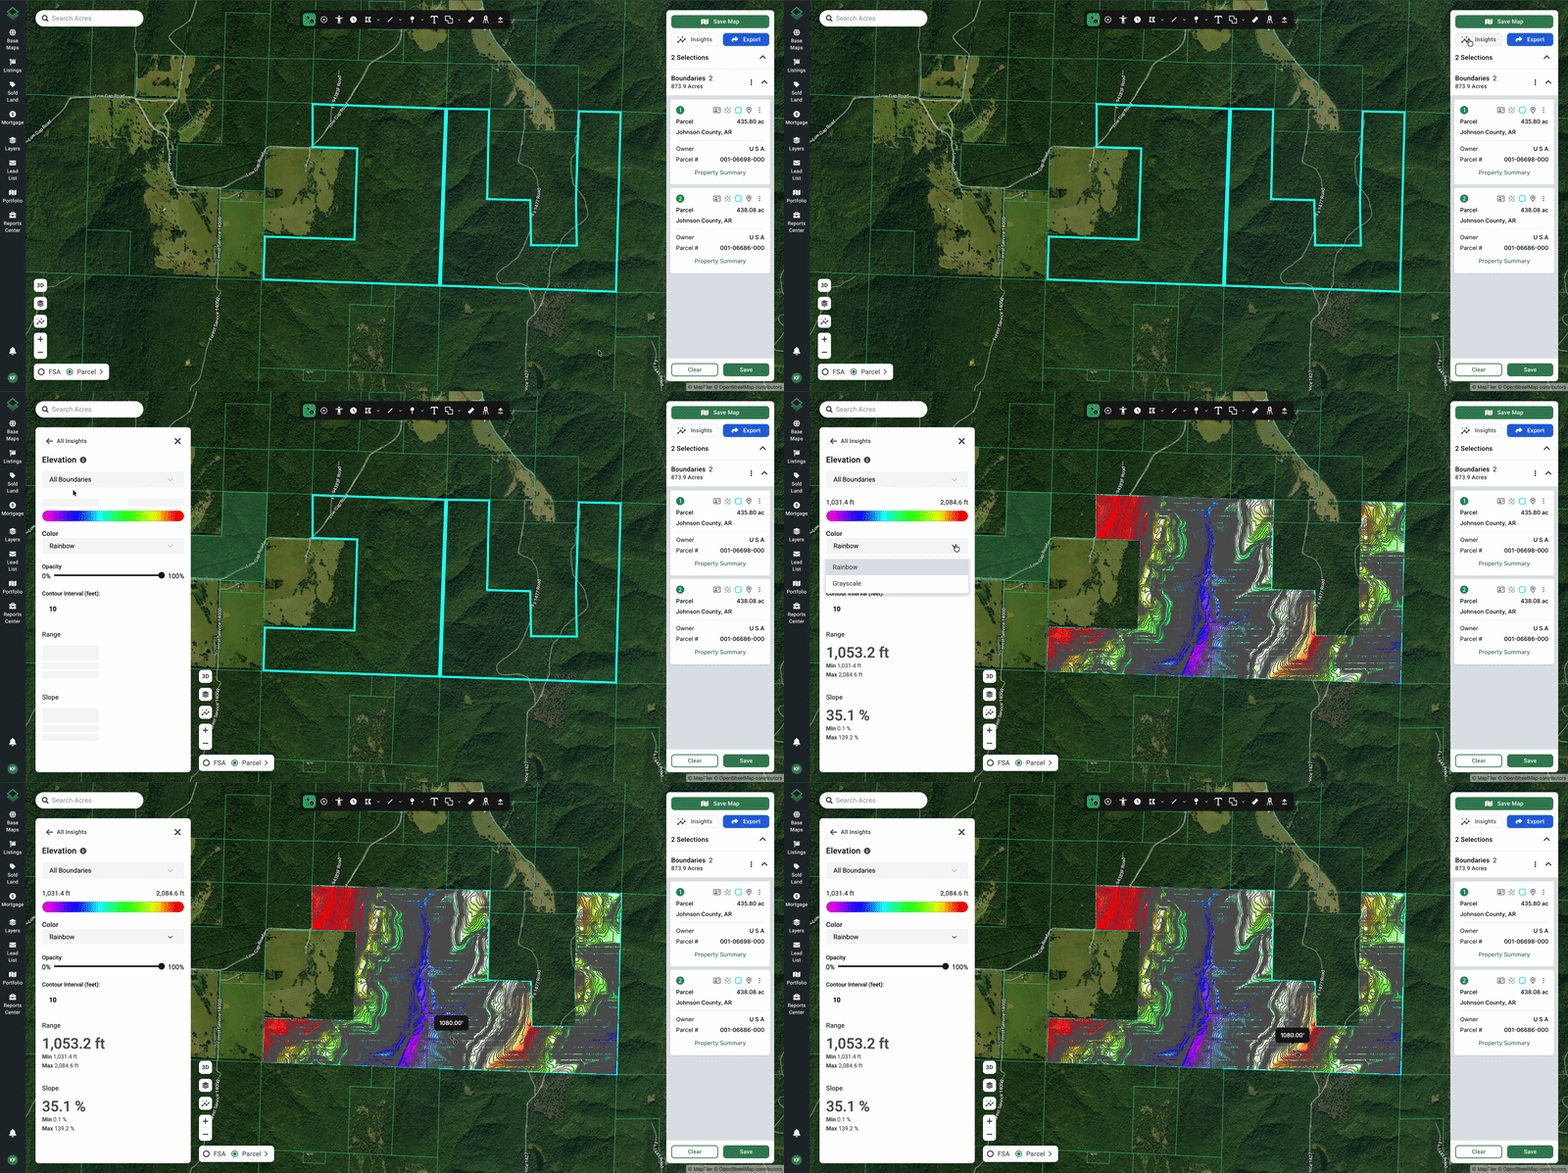
To view Elevation within the Insights panel, follow these steps:
- Start by making a selection on the map.
- At the top of the Selections List Panel click Insights > Elevation.
- A new panel will appear showing a legend bar for the heat map and contour lines that are now overlaid on your currently selected land.
- The Contour Interval field allows you to customize the intervals of contour lines by feet. (Note: The lowest interval you can enter is 0.1 and the highest is 50.)
- Range and Slope information are also displayed.
- You can choose to view the intervals in Rainbow or in Greyscale.
Tip: The selections dropdown menu at the top of the panel will allow you to filter results for individual selections.
Elevation can also be viewed...
- On our customizable Property Reports
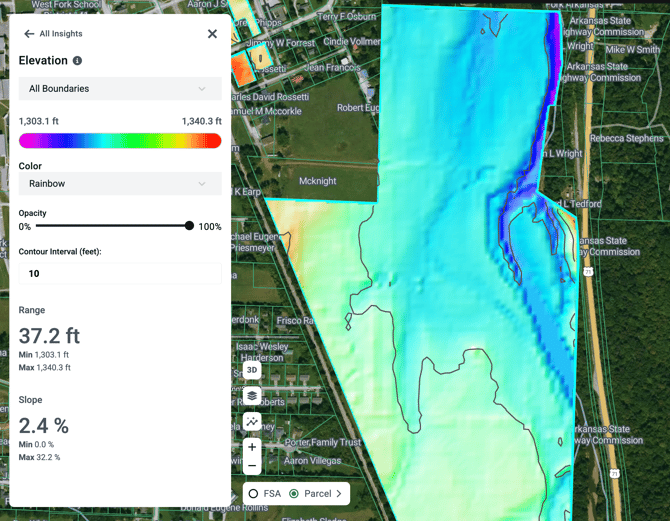
- On our Property Summary for individual parcels (as shown below)
Quick Shortcut: Click the Insights icon on the bottom left of the screen to quickly toggle on the Elevation Insight Overlay.