
Acres provides several interactive map layers to help you analyze individual parcels.
Available Insights
- Data Layers: Elevation, Flood, Historical Imagery, Land Cover, Soils, Timber Site Index, Vegetation Index, Water, and Property Tax.
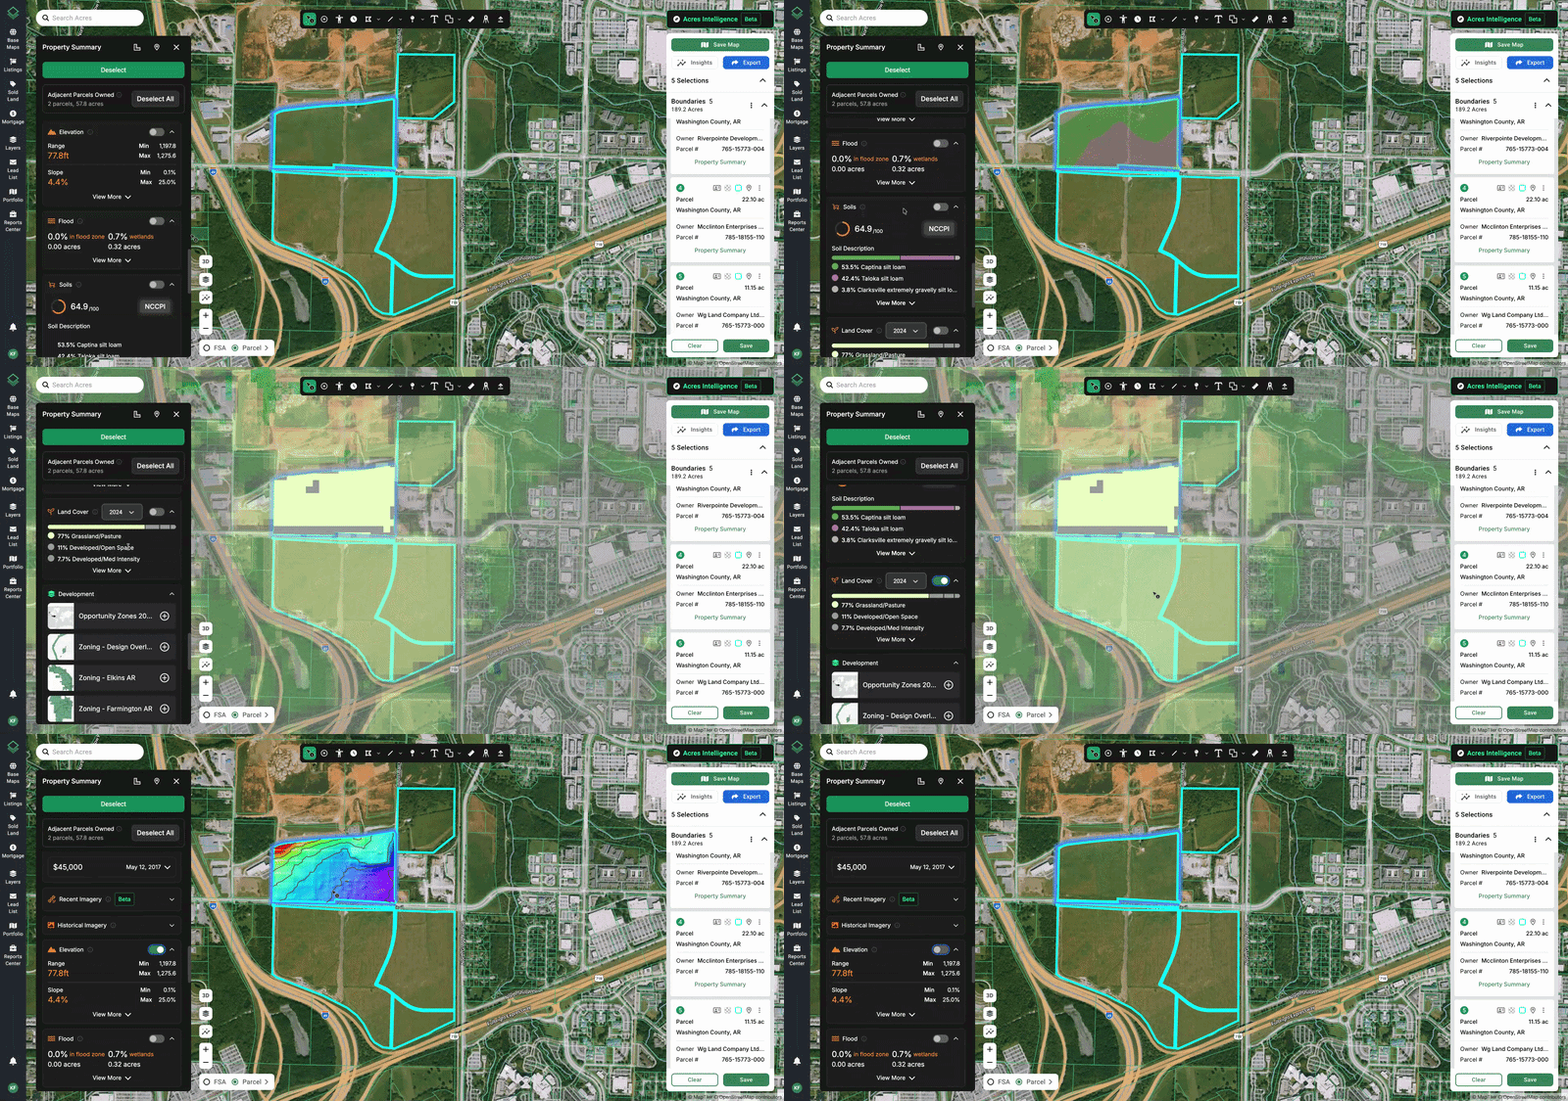
1. View key insights of an individual parcel in our Property Summary
To review key insights in the Property Summary:
- Open the summary: Click View Details on a selected boundary or use the Info Cursor to click any parcel on the map.
- Locate insights: Scroll down the left-hand panel to view available data layers.
- Control map layers: Hover over insights for a quick preview, or toggle them on to stack and display multiple layers while you work.
2. View insights of all selected boundaries through our Insights panel
To use any of the insights layers, start by selecting a parcel or parcels on the map. These will populate on your Selections Panel on the right side of the map. (Learn more here.)
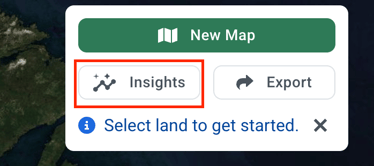
Next, open the Insights tab located at the top of your Selection’s List.
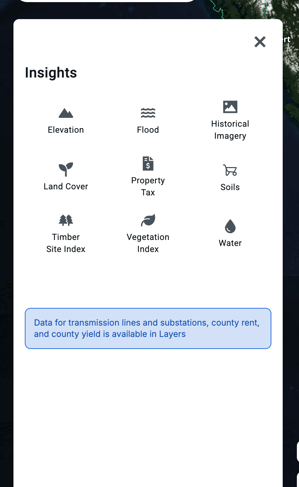
Once you choose an Insight, you will be able to view the associated data in the Insights panel and/or as an overlay on the parcel(s) you selected. Below is an example using Elevation, which displays data for this parcel both in the Insights panel and on the map.
Certain Insights have customization options available — for example, with Elevation you can adjust the contour interval (between 0.1 and 50 feet) or opacity of the heat map.
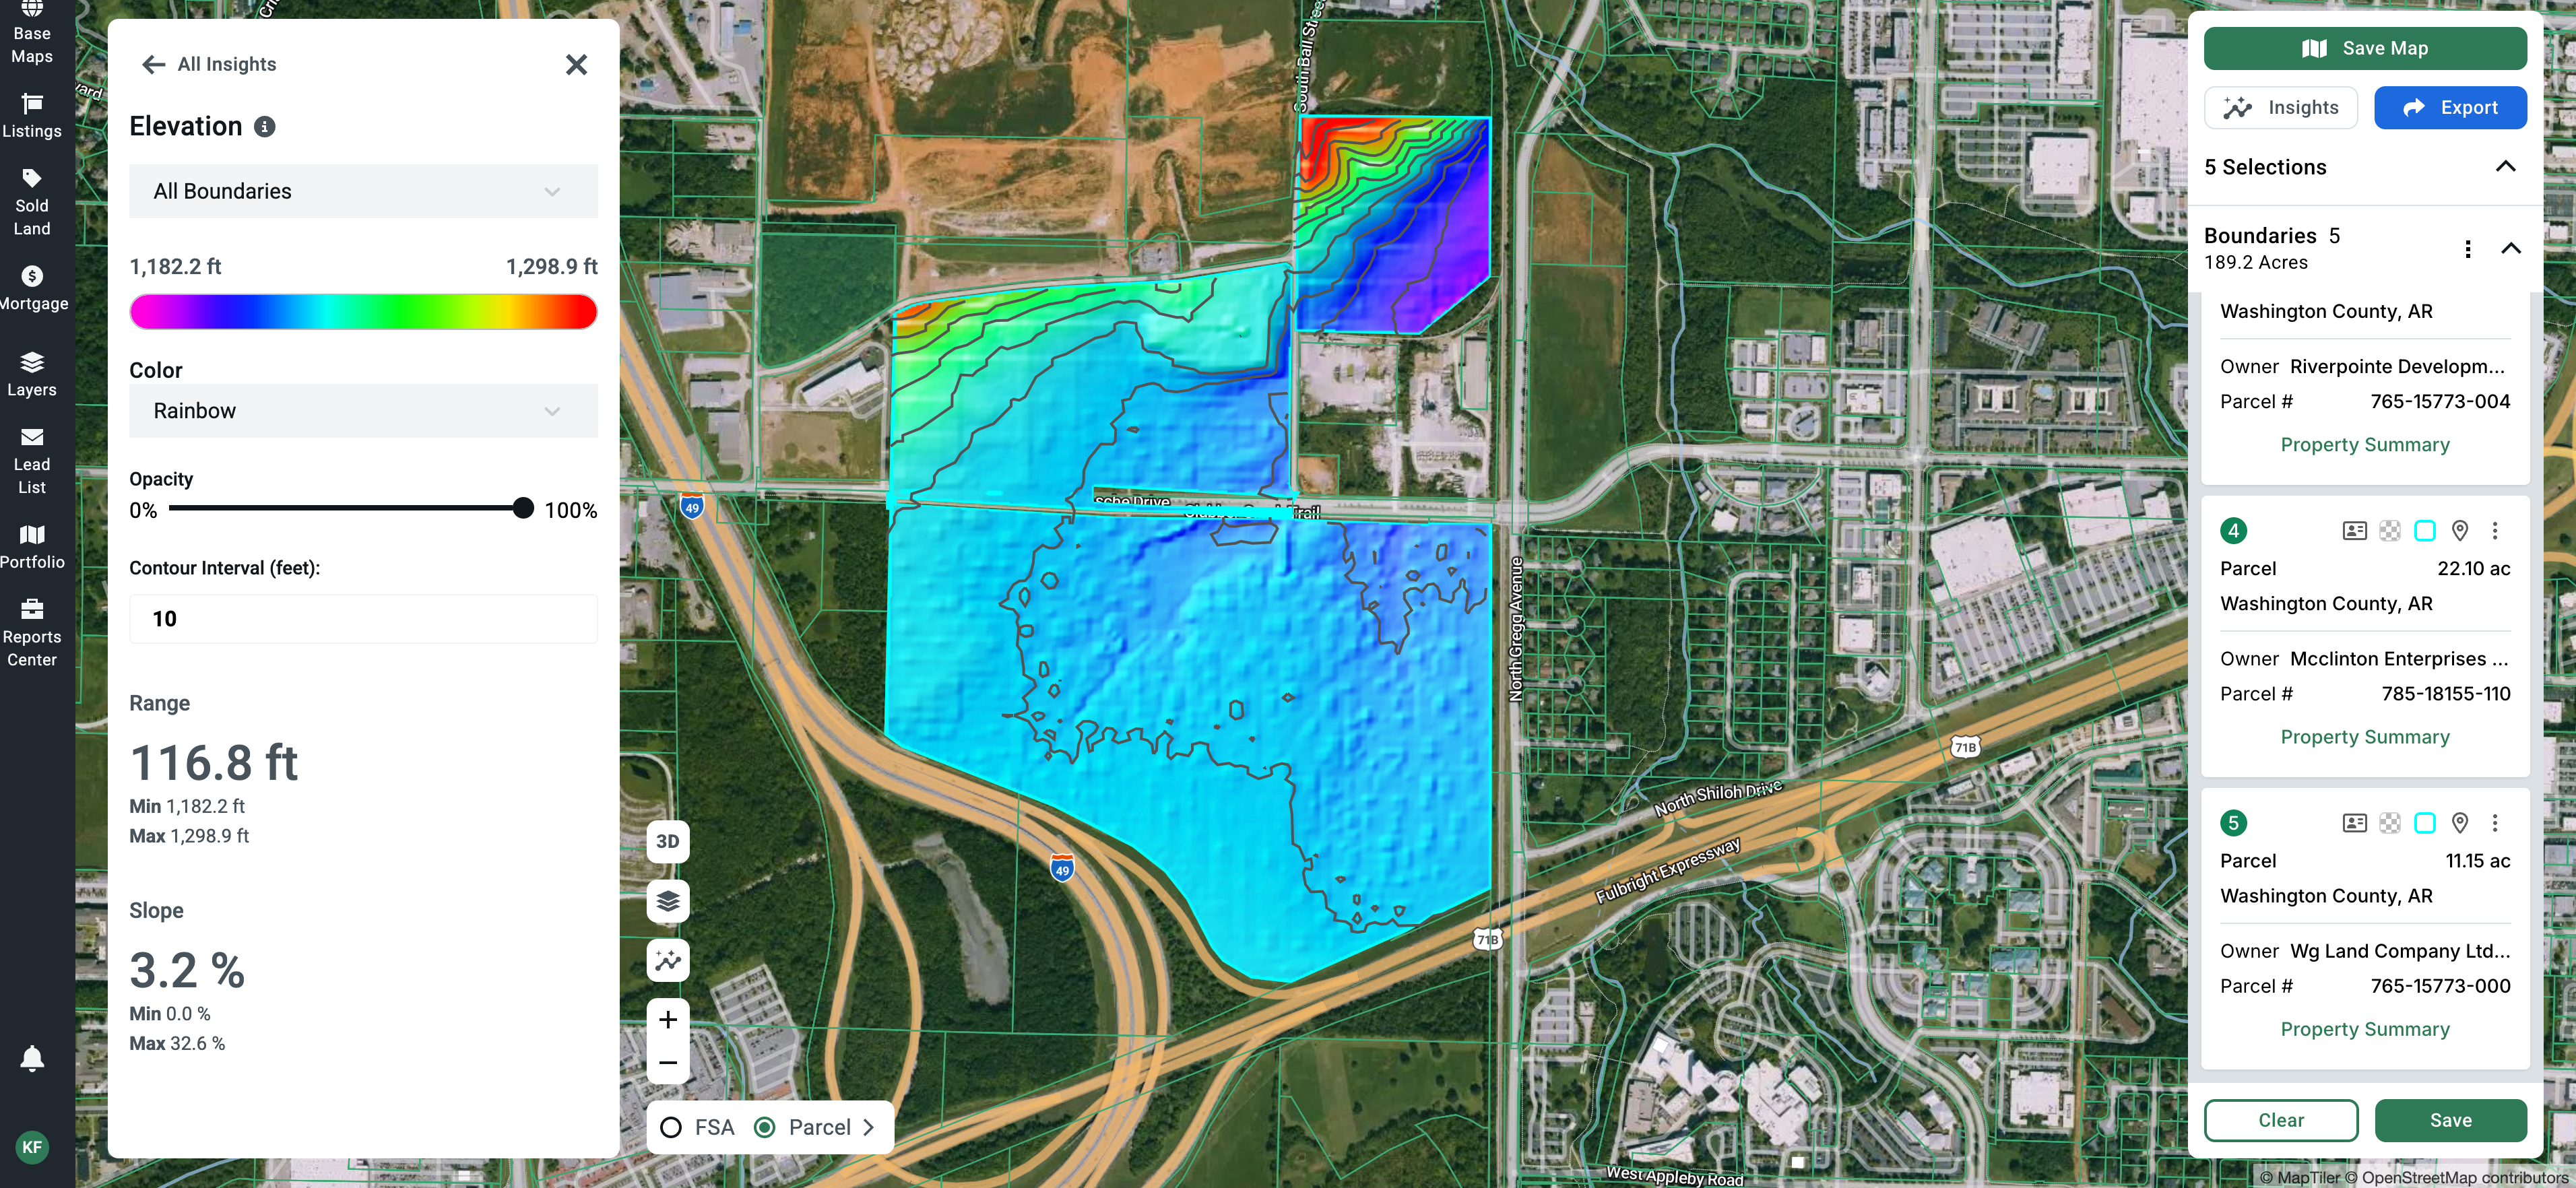
Note: If you have multiple boundaries selected, the insight will be displayed on all boundaries (within 32,000 acres in size or distance), and any calculations will be for the aggregate of all boundaries. Click "All Boundaries" at the top to isolate the insight to a specific selected parcel.
Learn more about our primary insights through these support articles: